Channel 3000, WISC-TV, of Madison Wisconsin USA, posted on its web site a very short article on April 15, 2002, titled "Missouri Man Claims He Has Piece Of UFO."
It tells that a man named Bob White, owns an alleged UFO fragment, and already spent $200,000 to have the object analyzed, and placed a classified advertisement to sell them with a price tag of $10 million. White said he has already received some offers, but he would not say for how much.
Bob White is of Reeds Spring, Montana, says he found the silver, two-pound metallic object, in the early '80s in Colorado after seeing a strange light in the sky.
He says the analysis have indicated that the object is 80 percent aluminum, but it also contains 30 rare earth components and some things that cannot be identified.
Note: The story of this fragment itself is actually not surfacing just now and was already told on several web site. I have not taken the time yet to look at this topic in detail but I will.
Underneath: two photographs of the alleged fragment as they appeared on the Channel 3000 web page when they released the above news item.
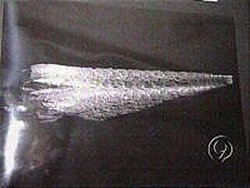
|

|
The following is the full text of the report that NIDS published on the analysis of the fragment that came from Mr. White. I draw your attention to the last section of the analytical lab's report entitled Summary and Conclusions. The report is on the NIDS web site at http://www.nidsci.org.
Mr. White, a Missouri resident, provided the National Institute for Discovery Science (NIDS) a piece of material that he purportedly obtained under unusual circumstances.
Since the material had not been previously tested, NIDS decided to have a battery of tests conducted. The material was delivered to New Mexico Tech, and the tests were conducted under the direction of Dr. Paul Fuierer, an Assistant Professor in the Materials Engineering Department. On August 23, 1996, Dr. Fuierer submitted his analysis, Sample Analysis Report: Sample #2.
The analysis were double blinded. The following is the entire text of the report. No conclusions are made by NIDS.
Sample #2 in its as-received condition can be described as a finger-shaped piece of metal approximately 30 mm long, 7 mm thick, 18 mm wide at its larger end and 10 mm wide at the smaller end. The interior of the specimen is silver-white in color, and highly reflecting. The outside surface has a tarnished, darker gray appearance with overlapping scale-like features. The sample mass was 5.11524 g.
A semi-quantitative elemental analysis was obtained using a Philips 2400 X-ray Fluorescence (wavelength dispersive) Spectrometer. A scan of the entire bulk sample identified as major constituents: 85 wt % A1 and 9 wt % Si, and minor constituents: 2 wt% Fe, 0.9 wt% Ca, 0.7 wt% S, 0.6 wt% C1, and 0.6 wt% Na along with several other elements (see Table I). This was in agreement with the qualitative analysis done via Energy Dispersive Spectroscopy (EDS) during the electron microscopy investigation (next section), which detected aluminum, silicon, and iron. In terms of its chemical composition, sample #2 appears to be similar to what is known as a "360 aluminum casting alloy".
An X-ray diffraction scan was performed on a slice of the sample with an area of about 1 cm^2. The diffraction pattern is shown in Fig. 1. A13.21Si0.47 is seen to be an excellent match. This composition calculates to 86.8 wt% A1 and 13.2 wt% Si, very close to that of sample #2. The four largest peaks are attributed to the aluminum metal, while the three small peaks (d = 3.1349, d = 1.9221, and d = 1.6375) are due to the presence of silicon. The aluminum peaks are shifted slightly to lower angles and larger d-spacings, as a result of the incorporation of a small amount of other larger metallic impurities into the lattice. The sample can therefore be described as a two-phase mixture of an aluminum solid solution as the majority phase, and silicon as a minor phase. This is in agreement with the equilibrium phase diagram for the Al-Si binary system, shown in Fig. 2. The composition of sample #2 is close to the eutectic composition, which is the composition have the lowest melting point (12.6 % Si according to the published phase diagram).
Scanning Electron Micropcopy (SEM)
The same slice of sample used for XRD was prepared by grinding and polishing to a mirror finish, followed by etching with 0.5% HF acid for 40 sec. Examination under the electron microscope revealed the microstructure to be quite uniform throughout the sample. Fig. 3 shows low and high magnification shots of the prepared surface. The sample contained a large amount of porosity (darker areas are pits and voids). Also apparent are the small particles (tenths of microns in size) surrounded by the continuous matrix material. EDS revealed the small, light particles to be silicon rich, while the darker gray matrix is Al-rich, as expected (see Fig. 4).
Optical Microscopy
Two samples were cut for metallographic examination; one sliced perpendicular to the length of the sample, and one parallel. These sections were also ground, polished and etched with 0.5% HF. Fig. 5 shows a couple of low mag shots of the parallel sample. The high porosity is very apparent, along with the very fine microstructure. Flow lines are also apparent in these two shots. The coarse ones are easy to see, outlined by the porosity. A more subtle flow line can be seen in the 250X shot upon close examination, defined only by a slight difference in the density of the darker particles on either side. These kinds of flow lines are commonly observed in poor sand or die castings. These are caused by a failure of molten streams of metal to merge due to poor filling of a mold, incorrect die lubrication or incorrect injection pressures.
Only under 1000X magnification can one start to pick out individual black particles (Fig. 6). These tiny black particles are the same Si particles seen under the SEM as light particles. Unfortunately, sub-micron sized features approach the theoretical limit of resolution for a light microscope, and therefore do not reveal themselves very clearly. However, they seem to have grouped together in certain locations to form longer bands, either straight or curved. These are probably dislocations (highly strained defects in the Al lattice) where precipitation of a second phase often occurs.
The fine microstructure observed in sample #2 is exactly what one might expect from a near eutectic composition of the Al and Si with a significant amount of impurities. Since the eutectic is rich in aluminum, one would predict an Al-rich solid solution matrix with isolated particles of silicon.....just what we have. The fact that the Si particles are spheroidized (essentially equiaxed spherical particles) as opposed to the classic eutectic lamellar shape (elongated plates or needles) can be explained by the significant quantity of impurities like Na, Mg, etc. These are regarded as modifiers in metal alloy technology, which alter surface energies and affect the morphology of the second phase silicon.
Putting all of the above microstructural observations together, one can surmise that the metal was being deformed (pushed or blown) as it cooled from the molten state through the eutectic temperature (~ 577 degrees C) and solidified. It probably cooled fairly rapidly since the Si particles are rather small. Also the alloy may have been undercooled such that excess Si was left in solid solution, and then later precipitated out at the dislocations during either normal or artificial aging.
Density
Bulk density of the sample was measured based on the Archimedes Principle by immersion in toluene. The mass, while immersed, increased over a long period of time, finally stabilizing after 3 hours, indicative of a highly porous sample. The density of sample #2 was calculated to be 2.47 g/cm^3. This is 91% of that of the theoretical density of pure A1 (2.71 g/cm^3). This is not surprising, considering the presence of undisolved silicon (2.33 g/cm^3) and significant amount of void space observed under the microscope.
Hardness
The same samples (both perpendicular and parallel cuts) used for optical microscopy were used to measure hardness. A Vickers Hardness number was obtained from a Leco Tester using a diamond tip micro-indenter. Five indentations were made for each sample. The size of the resulting indentations were measured under the light microscope, and averaged. This average value, along with the known applied load were used to come up with the Vicker's Hardness number. For the perpendicular cut, VH = 60. For the parallel cut, VH = 62. The difference is probably within experimental error. These values are slightly higher than pure aluminum, and typical for aluminum alloys.
Stiffness
An attempt was made to prepare a specimen for measuring the strength and stiffness (elastic modulus) of sample #2 using an Instron machine, however; the sample proved to be to small.
Electrical Properties
A four-point probe must be used for accurate measurement for highly conducting materials like metals. For this, a rectangular slab sample was cut and polished to dimensions: length = 11.16 mm, width = 3.36 mm, and thickness = 0.38 mm. A digital multimeter was used to measure the current (provided by a constant current source) through the length of the sample, while an electrometer was used to measure the voltage drop (to the nearest 0.00001 V) across a length of the slab. The resistivity of sample #2 was measured to be 2.90 x 10^-5 Ohm-cm. This is about an order of magnitude higher than that of pure aluminum (3 x 10^-6 Ohm-cm) and five times higher than that of 360 Al alloy (6x10^-6 Ohm-cm). This is completely reasonable, considering the large number of Si particles, dislocation lines, and amount of porosity.
Results from the analysis of sample #2 are quite conclusive. The specimen is an aluminum-silicon alloy, with a substantial amount of variety of impurities, including iron, calcium, sulfur, chlorine, sodium, magnesium and others. The composition is one that could be used as an aluminum casting alloy. The closest commercial material has the trade name "360 alloy" [Lyman, 1961]. This is a die casting alloy used in applications where excellent castability and resistance to corrosion are required. It is used for miscellaneous thin-walled and intricate castings. Since this type of alloy is very close to the eutectic (lowest melting) composition, it has excellent fluidity at relatively low temperatures.
The microstructure of the sample is one to be expected from the composition: second phase eutectic silicon particles in a matrix of aluminum solid solution. However, due to a few undesirable structural characteristics, it would be regarded as a poorly cast aluminum alloy when compared with published micrographs of commercial materials [Lyman, 1972]. The large amount of porosity would certainly lead to a decreased strength and decreased corrosion resistance. The presence of porosity together with the apparent flow lines suggests that uncontrolled cooling took place. The significant amount of impurities like sodium accounts for the fineness and rounded nature of the silicon particles, rather than the larger, longer, more angular particules usually observed. Dislocations (planes of slip caused by plastic deformation) appear to be decorated by silicon particles. In many cases, these dislocations follow the flow lines. This suggests some forced flow during solidification of the melt (in the range of temperatures 600 degrees C to 575 degrees C).
There are no anomalies in the results of this analysis. The detected phases are accounted for, and the microstructure lends itself to standard metallurgical interpretation. The physical properties that were measured (density, hardness, and electrical resistivity) all fall within the expected range.